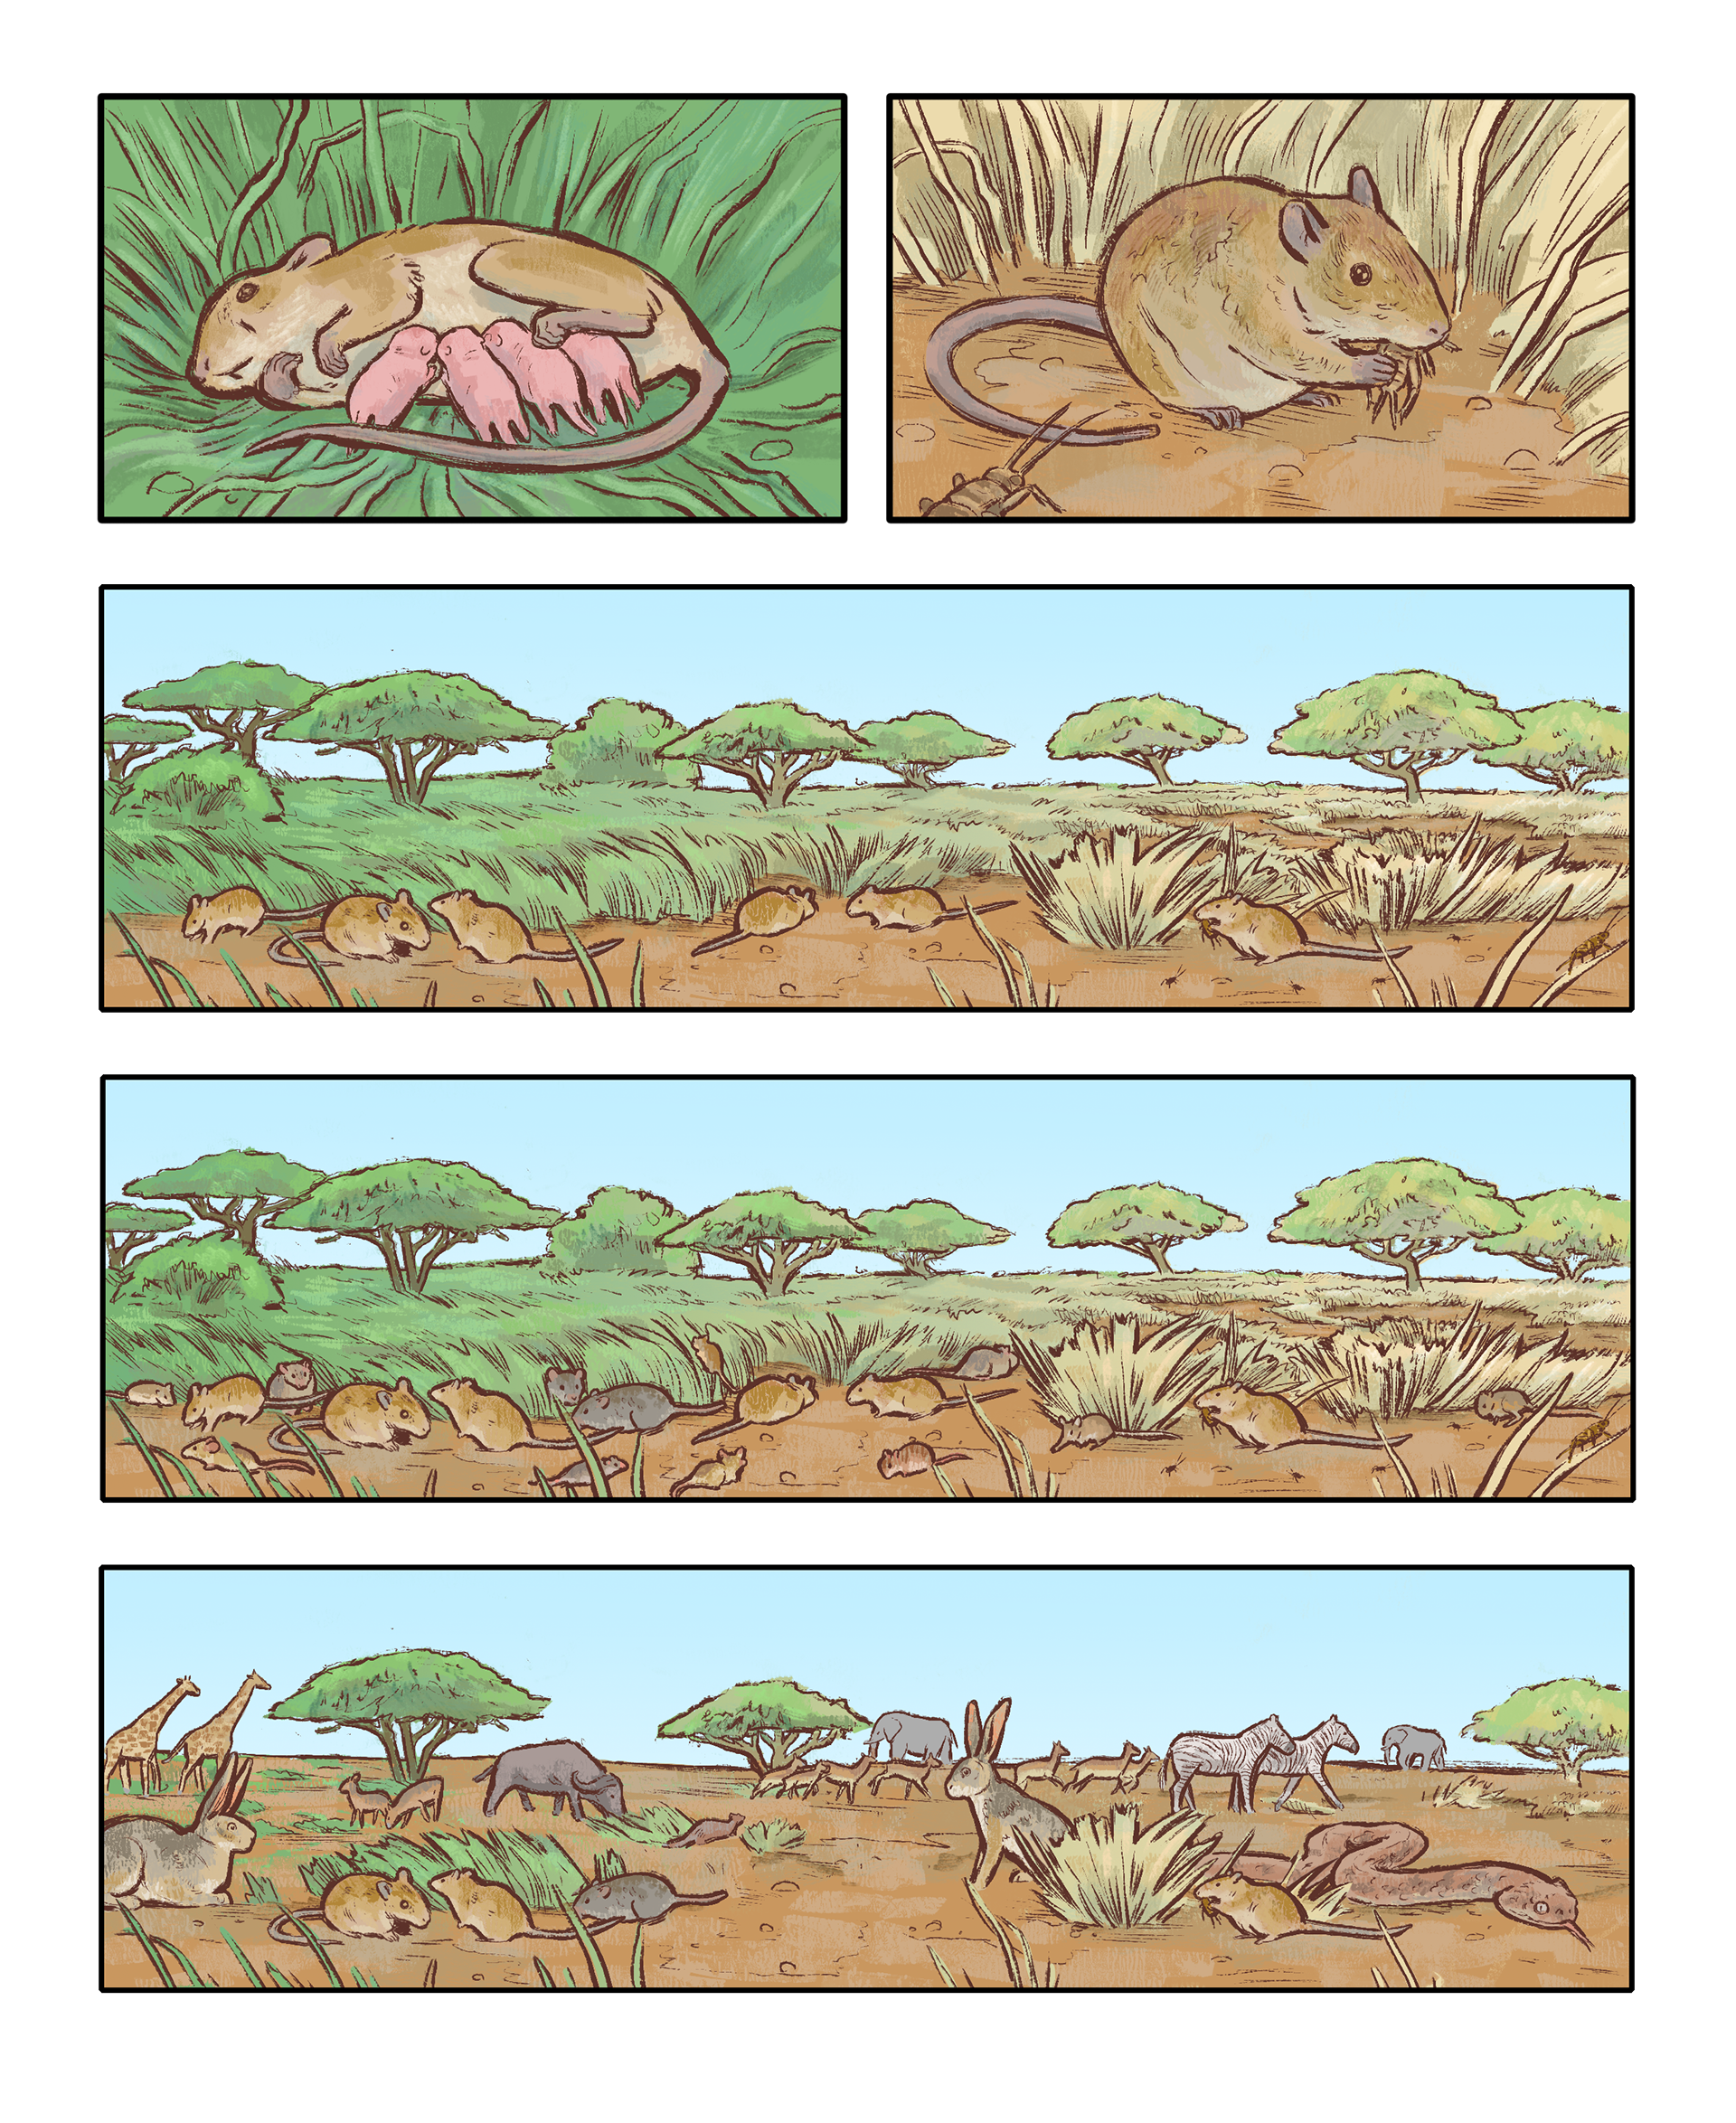
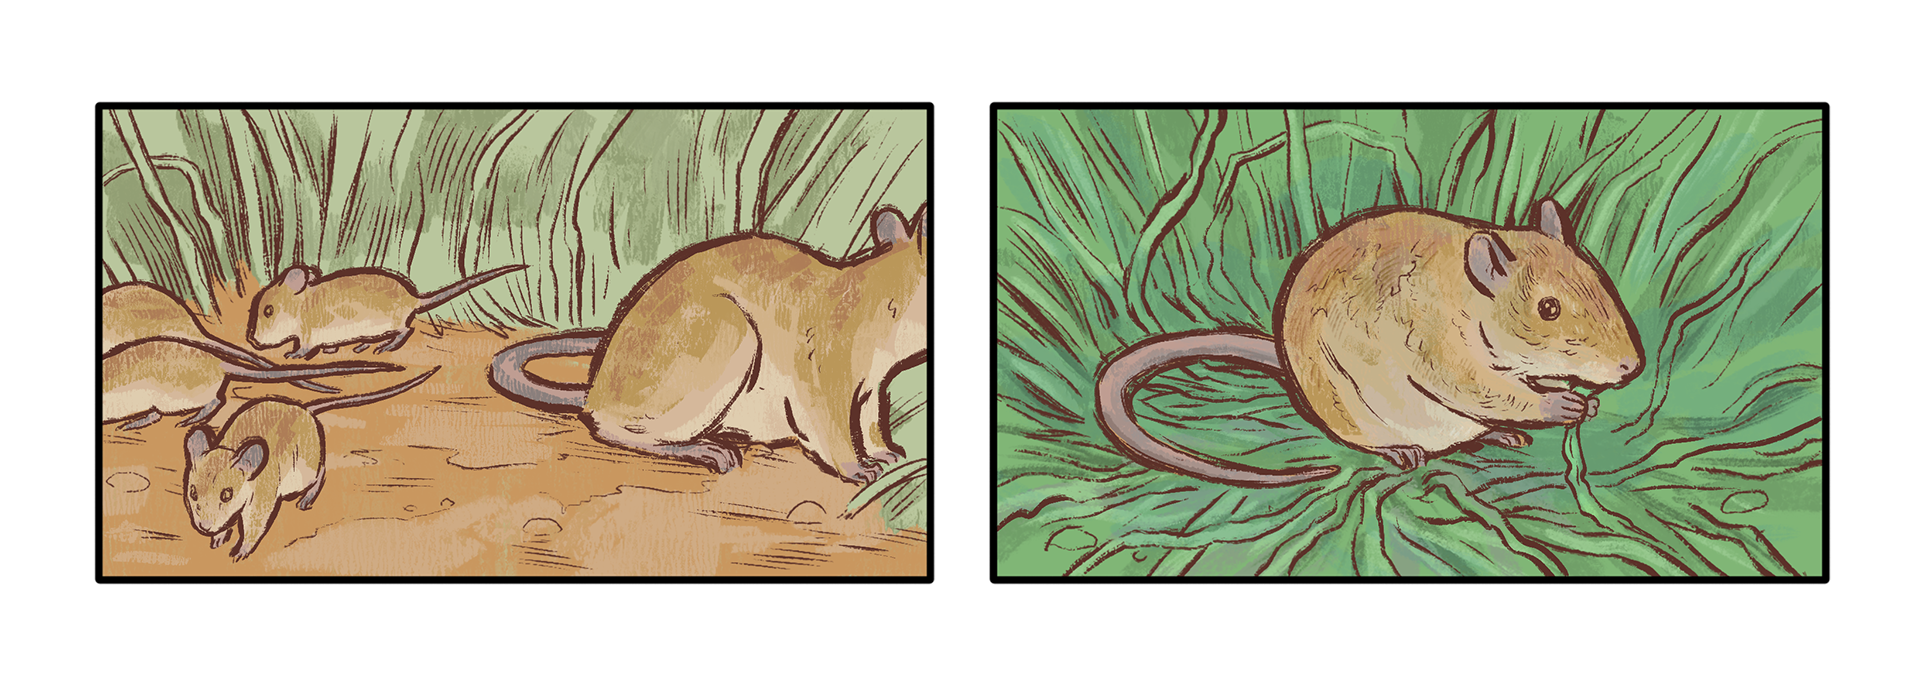
Illustrations included in a Brown University Dept. of Ecology and Evolutionary Biology study examining the effects of large mammal exclusion on rodent diversity and microbiome across seasons and geographic location
The biggest challenge here was addressing so many separate dimensions of data in one figure simultaneously. I thought it was a worthwhile problem to solve not only for simplicity and efficiency, but if one can see the interactions of these different factors all in one place then we have a more intuitive and powerful way of digesting the information.
In these final illustrations we can see the intermingling gradients of seasonality, flora/fauna distributions, geography, and life cycles.